
Menu
The Birds of Concern (BOC) in the Chicago Wilderness (CW) region is a list of species
needing priority attention and management.
This BOC list was developed using regional lists of species of concern in the
Partners in Flight (PIF) Species Assessment Database (2013). The CW region is
on the edge of two PIF Bird Conservation Regions, BCR 22 and 23. PIF priority
levels from both BCRs were adjusted using population trends, distribution,
threats, and breeding success data for our area. The migrants list was created
by evaluating PIF scores in regions north of the CW area. A number of listed
species not ranked by PIF are from other data sources – the Upper Mississippi
River & Great Lakes Joint Venture's Habitat Strategies for Shorebirds, Waterfowl
and Waterbirds, and endangered and threatened species from: IL, IN, WI, & MI. A .pdf copy of the list below can be downloaded here. Print copies of this list are also available thanks to funding by the Illinois Department of Natural Resources
from contributions to the Illinois Wildlife Preservation Fund. To request print copies, please Contact the BCN Office.
For additional details about the methods used to produce the list below, please read the full Review Process.
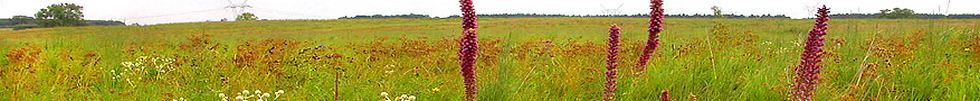
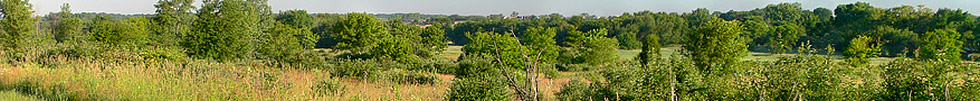
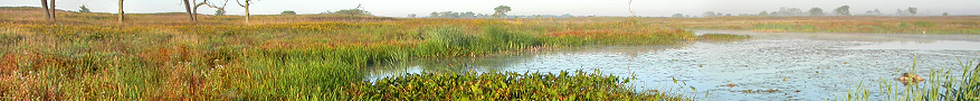
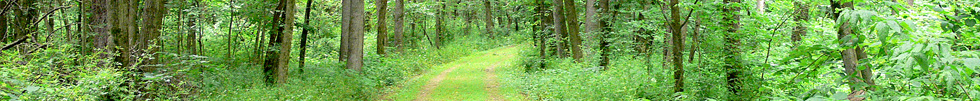
Grassland | Shrubland | Woodland | Wetland | Urban/Introduced | Migrants
| Immediate Management Needed: Species having high regional threats and experiencing large population declines. Conservation action needed to reverse or stabilize long-term declines. | ||||
| Species experiencing moderate to strong declines and/or threats to breeding. Management or other actions needed to stabilize/ increase populations or reverse threats. | ||||
| Declines or threats to regional populations. Require management and monitoring. Includes certain widespread species plus species using only limited/localized habitats. | ||||
| Frequency | % of all BCN Survey points where the species was detected at least once. A gauge of how common or uncommon a species is in the CW region. The dots are a visual key to that relative abundance. |


PRINT BROCHURES: Funded by the Illinois Department of Natural Resources from contributions to the Illinois Wildlife Preservation Fund